
|
SVP Technology at Fiserv; large scale system architecture/infrastructure, tech geek, reading, learning, hiking, GeoCaching, ham radio, married, kids
|

A Network Artist left an interesting remark on one of my blog posts:
It’s kind of confusing sometimes to see the digital twin (being a really good idea) never really take off.
His remark prompted me to resurface a two-year-old draft listing a bunch of minor annoyances that make Networking Digital Twins more of a PowerPoint project than a reality.


Another scary tale from the Archives of Sloppy Code: we can’t decide whether some attributes are mandatory or optional.
When I was fixing the errors in netlab SR-OS configuration templates, I couldn’t get the EBGP-based EVPN with overlapping leaf AS numbers to work. I could see the EVPN routes in the SR-OS BGP table, but the device refused to use them. I concluded (incorrectly) that there must be a quirk in the SR-OS EVPN code and moved on.

Around 2012-2013 I started to hear a lot in the sysadmin community about a technology called "Borg". It was (apparently) some sort of Linux container system inside of Google that ran all of their stuff. The terminology was a bit baffling, with something called a "Borglet" inside of clusters with "cells" but the basics started to leak. There was a concept of "services" and a concept of "jobs", where applications could use services to respond to user requests and then jobs to complete batch jobs that ran for much longer periods of time.
Then on June 7th, 2014, we got our first commit of Kubernetes. The Greek word for 'helmsman' that absolutely no one could pronounce correctly for the first three years. (Is it koo-ber-NET-ees? koo-ber-NEET-ees? Just give up and call it k8s like the rest of us.)
Microsoft, RedHat, IBM, Docker join the Kubernetes community pretty quickly after this, which raised Kubernetes from an interesting Google thing to "maybe this is a real product?" On July 21st 2015 we got the v1.0 release as well as the creation of the CNCF.
In the ten years since that initial commit, Kubernetes has become a large part of my professional life. I use it at home, at work, on side projects—anywhere it makes sense. It's a tool with a steep learning curve, but it's also a massive force multiplier. We no longer "manage infrastructure" at the server level; everything is declarative, scalable, recoverable and (if you’re lucky) self-healing.
But the journey hasn't been without problems. Some common trends have emerged, where mistakes or misconfiguration arise from where Kubernetes isn't opinionated enough. Even ten years on, we're still seeing a lot of churn inside of ecosystem and people stepping on well-documented landmines. So, knowing what we know now, what could we do differently to make this great tool even more applicable to more people and problems?
What did k8s get right?
Let's start with the positive stuff. Why are we still talking about this platform now?
Containers at scale
Containers as a tool for software development make perfect sense. Ditch the confusion of individual laptop configuration and have one standard, disposable concept that works across the entire stack. While tools like Docker Compose allowed for some deployments of containers, they were clunky and still required you as the admin to manage a lot of the steps. I set up a Compose stack with a deployment script that would remove the instance from the load balancer, pull the new containers, make sure they started and then re-added it to the LB, as did lots of folks.
K8s allowed for this concept to scale out, meaning it was possible to take a container from your laptop and deploy an identical container across thousands of servers. This flexibility allowed organizations to revisit their entire design strategy, dropping monoliths and adopting more flexible (and often more complicated) micro-service designs.
Low-Maintenance
If you think of the history of Operations as a sort of "naming timeline from pets to cattle", we started with what I affectionately call the "Simpsons" era. Servers were bare metal boxes set up by teams, they often had one-off names that became slang inside of teams and everything was a snowflake. The longer a server ran, the more cruft it picked up until it became a scary operation to even reboot them, much less attempt to rebuild them. I call it the "Simpsons" era because among the jobs I was working at the time, naming them after Simpsons characters was surprisingly common. Nothing fixed itself, everything was a manual operation.
Then we transition into the "01 Era". Tools like Puppet and Ansible have become common place, servers are more disposable and you start to see things like bastion hosts and other access control systems become the norm. Servers aren't all facing the internet, they're behind a load balancer and we've dropped the cute names for stuff like "app01" or "vpn02". Organizations designed it so they could lose some of their servers some of the time. However failures still weren't self-healing, someone still had to SSH in to see what broke, write up a fix in the tooling and then deploy it across the entire fleet. OS upgrades were still complicated affairs.
We're now in the "UUID Era". Servers exist to run containers, they are entirely disposable concepts. Nobody cares about how long a particular version of the OS is supported for, you just bake a new AMI and replace the entire machine. K8s wasn't the only technology enabling this, but it was the one that accelerated it. Now the idea of a bastion server with SSH keys that I go to the underlying server to fix problems is seen as more of a "break-glass" solution. Almost all solutions are "destroy that Node, let k8s reorganize things as needed, make a new Node".
A lot of the Linux skills that were critical to my career are largely nice to have now, not need to have. You can be happy or sad about that, I certainly switch between the two emotions on a regular basis, but it's just the truth.
Running Jobs
The k8s jobs system isn't perfect, but it's so much better than the "snowflake cron01 box" that was an extremely common sight at jobs for years. Running on a cron schedule or running from a message queue, it was now possible to reliably put jobs into a queue, have them get run, have them restart if they didn't work and then move on with your life.
Not only does this free up humans from a time-consuming and boring task, but it's also simply a more efficient use of resources. You are still spinning up a pod for every item in the queue, but your teams have a lot of flexibility inside of the "pod" concept for what they need to run and how they want to run it. This has really been a quality of life improvement for a lot of people, myself included, who just need to be able to easily background tasks and not think about them again.
Service Discoverability and Load Balancing
Hard-coded IP addresses that lived inside of applications as the template for where requests should be routed has been a curse following me around for years. If you were lucky, these dependencies weren't based on IP address but were actually DNS entries and you could change the thing behind the DNS entry without coordinating a deployment of a million applications.
K8s allowed for simple DNS names to call other services. It removed an entire category of errors and hassle and simplified the entire thing down. With the Service API you had a stable, long lived IP and hostname that you could just point things towards and not think about any of the underlying concepts. You even have concepts like ExternalName that allow you to treat external services like they're in the cluster.
What would I put in a Kubernetes 2.0?
Ditch YAML for HCL
YAML was appealing because it wasn't JSON or XML, which is like saying your new car is great because it's neither a horse nor a unicycle. It demos nicer for k8s, looks nicer sitting in a repo and has the illusion of being a simple file format. In reality. YAML is just too much for what we're trying to do with k8s and it's not a safe enough format. Indentation is error-prone, the files don't scale great (you really don't want a super long YAML file), debugging can be annoying. YAML has so many subtle behaviors outlined in its spec.
I still remember not believing what I was seeing the first time I saw the Norway Problem. For those lucky enough to not deal with it, the Norway Problem in YAML is when 'NO' gets interpreted as false. Imagine explaining to your Norwegian colleagues that their entire country evaluates to false in your configuration files. Add in accidental numbers from lack of quotes, the list goes on and on. There are much better posts on why YAML is crazy than I'm capable of writing: https://ruudvanasseldonk.com/2023/01/11/the-yaml-document-from-hell
Why HCL?
HCL is already the format for Terraform, so at least we'd only have to hate one configuration language instead of two. It's strongly typed with explicit types. There's already good validation mechanisms. It is specifically designed to do the job that we are asking YAML to do and it's not much harder to read. It has built-in functions people are already using that would allow us to remove some of the third-party tooling from the YAML workflow.
I would wager 30% of Kubernetes clusters today are already being managed with HCL via Terraform. We don't need the Terraform part to get a lot of the benefits of a superior configuration language.
The only downsides are that HCL is slightly more verbose than YAML, and its Mozilla Public License 2.0 (MPL-2.0) would require careful legal review for integration into an Apache 2.0 project like Kubernetes. However, for the quality-of-life improvements it offers, these are hurdles worth clearing.
Why HCL is better
Let's take a simple YAML file.
# YAML doesn't enforce types
replicas: "3"  # String instead of integer
resources:
  limits:
    memory: 512  # Missing unit suffix
  requests:
    cpu: 0.5m    # Typo in CPU unit (should be 500m)
Even in the most basic example, there are footguns everywhere. HCL and the type system would catch all of these problems.
replicas = 3  # Explicitly an integer

resources {
  limits {
    memory = "512Mi"  # String for memory values
  }
  requests {
    cpu = 0.5  # Number for CPU values
  }
}
Take a YAML file like this that you probably have 6000 in your k8s repo. Now look at HCL without needing external tooling.
# Need external tools or templating for dynamic values
apiVersion: v1
kind: ConfigMap
metadata:
  name: app-config
data:
  # Can't easily generate or transform values
  DATABASE_URL: "postgres://user:password@db:5432/mydb"
  API_KEY: "static-key-value"
  TIMESTAMP: "2023-06-18T00:00:00Z"  # Hard-coded timestamp
resource "kubernetes_config_map" "app_config" {
metadata {
name = "app-config"
}
data = {
DATABASE_URL = "postgres://${var.db_user}:${var.db_password}@${var.db_host}:${var.db_port}/${var.db_name}"
API_KEY = var.api_key != "" ? var.api_key : random_string.api_key.result
TIMESTAMP = timestamp()
}
}
resource "random_string" "api_key" {
length = 32
special = false
}Here's all the pros you get with this move.
- Type Safety: Preventing type-related errors before deployment
- Variables and References: Reducing duplication and improving maintainability
- Functions and Expressions: Enabling dynamic configuration generation
- Conditional Logic: Supporting environment-specific configurations
- Loops and Iteration: Simplifying repetitive configurations
- Better Comments: Improving documentation and readability
- Error Handling: Making errors easier to identify and fix
- Modularity: Enabling reuse of configuration components
- Validation: Preventing invalid configurations
- Data Transformations: Supporting complex data manipulations
Allow etcd swap-out
I know, I'm the 10,000 person to write this. Etcd has done a fine job, but it's a little crazy that it is the only tool for the job. For smaller clusters or smaller hardware configuration, it's a large use of resources in a cluster type where you will never hit the node count where it pays off. It's also a strange relationship between k8s and etcd now, where k8s is basically the only etcd customer left.
What I'm suggesting is taking the work of kine and making it official. It makes sense for the long-term health of the project to have the ability to plug in more backends, adding this abstraction means it (should) be easier to swap in new/different backends in the future and it also allows for more specific tuning depending on the hardware I'm putting out there.
What I suspect this would end up looking like is much like this: https://github.com/canonical/k8s-dqlite. Distributed SQlite in-memory with Raft consensus and almost zero upgrade work required that would allow cluster operators to have more flexibility with the persistence layer of their k8s installations. If you have a conventional server setup in a datacenter and etcd resource usage is not a problem, great! But this allows for lower-end k8s to be a nicer experience and (hopefully) reduces dependence on the etcd project.
Beyond Helm: A Native Package Manager
Helm is a perfect example of a temporary hack that has grown to be a permanent dependency. I'm grateful to the maintainers of Helm for all of their hard work, growing what was originally a hackathon project into the de-facto way to install software into k8s clusters. It has done as good a job as something could in fulfilling that role without having a deeper integration into k8s.
All that said, Helm is a nightmare to use. The Go templates are tricky to debug, often containing complex logic that results in really confusing error scenarios. The error messages you get from those scenarios are often gibberish. Helm isn't a very good package system because it fails at some of the basic tasks you need a package system to do, which are transitive dependencies and resolving conflicts between dependencies.
What do I mean?
Tell me what this conditional logic is trying to do:
# A real-world example of complex conditional logic in Helm
{{- if or (and .Values.rbac.create .Values.serviceAccount.create) (and .Values.rbac.create (not .Values.serviceAccount.create) .Values.serviceAccount.name) }}
apiVersion: rbac.authorization.k8s.io/v1
kind: ClusterRole
metadata:
  name: {{ template "myapp.fullname" . }}
  labels:
    {{- include "myapp.labels" . | nindent 4 }}
{{- end }}
Or if I provide multiple values files to my chart, which one wins:
helm install myapp ./mychart -f values-dev.yaml -f values-override.yaml --set service.type=NodePortOk, what if I want to manage my application and all the application dependencies with a Helm chart. This makes sense, I have an application that itself has dependencies on other stuff so I want to put them all together. So I define my sub-charts or umbrella charts inside of my Chart.yaml.
dependencies:
- name: nginx
  version: "1.2.3"
  repository: "<https://example.com/charts>"
- name: memcached
  version: "1.2.3"
  repository: "<https://another.example.com/charts>"
But assuming I have multiple applications, it's entirely possible that I have 2 services both with a dependency on nginx or whatever like this:
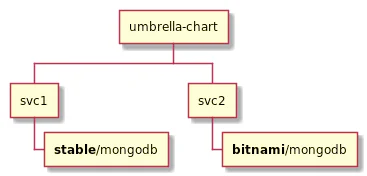
Helm doesn't handle this situation gracefully because template names are global with their templates loaded alphabetically. Basically you need to:
- Don't declare a dependency on the same chart more than once (hard to do for a lot of microservices)
- If you do have the same chart declared multiple times, has to use the exact same version
The list of issues goes on and on.
- Cross-Namespace installation stinks
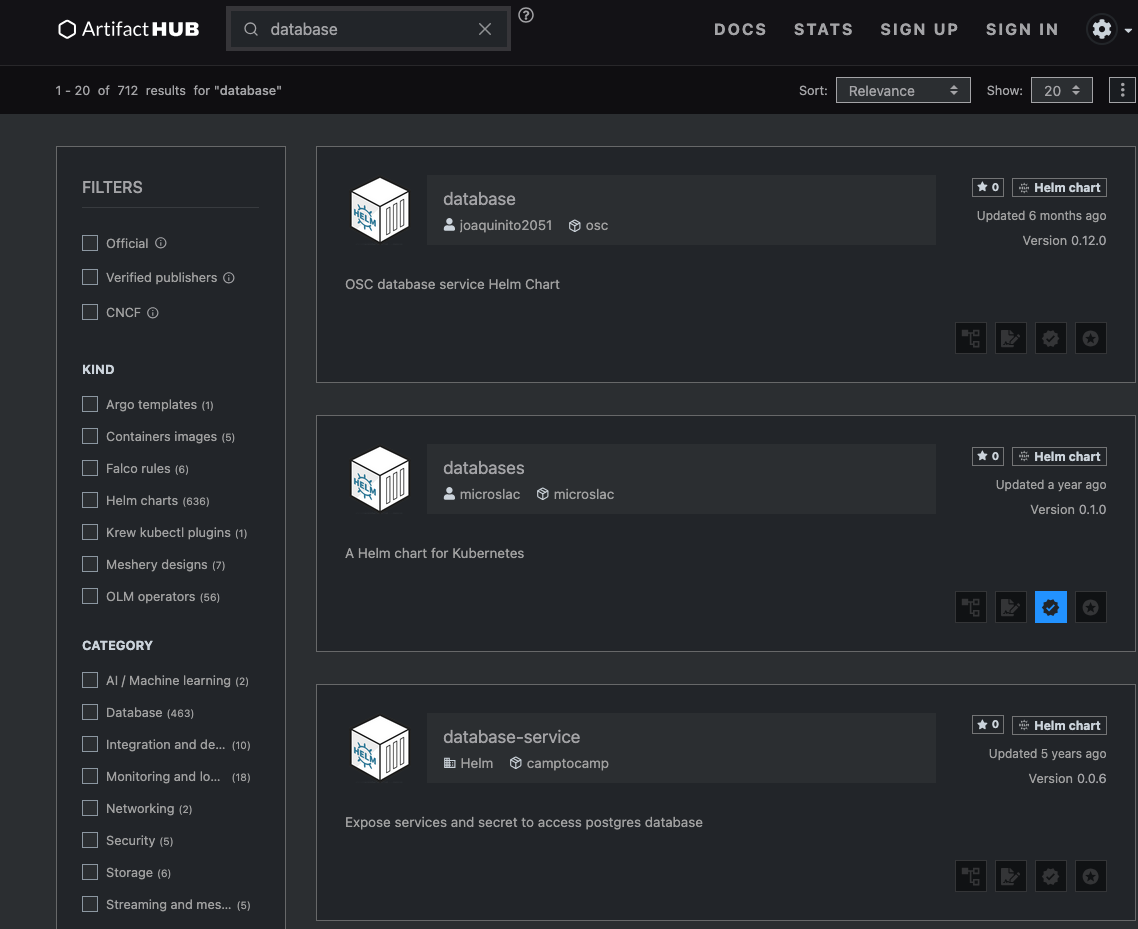
- Chart verification process is a pain and nobody uses it
Let's just go to the front page of artifacthub:
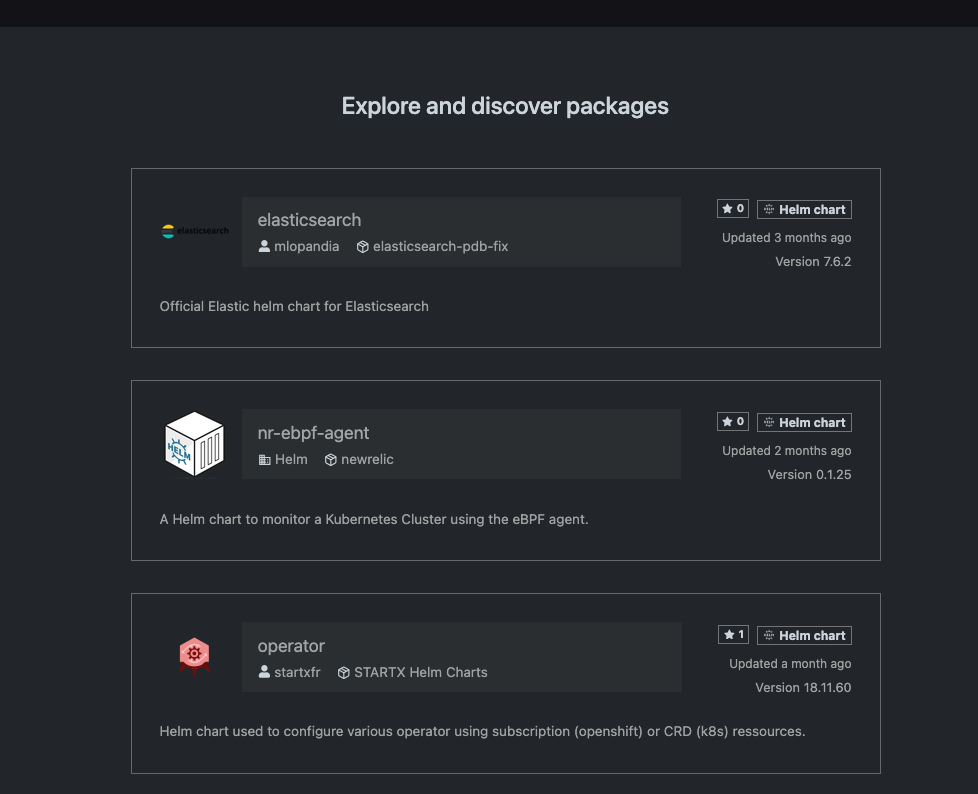
I'll grab elasticsearch cause that seems important.
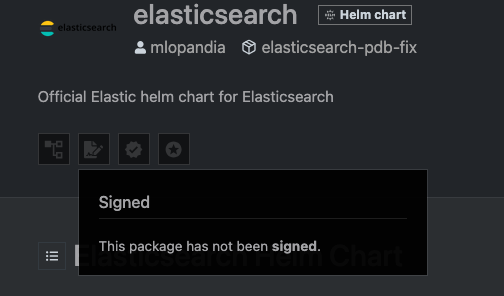
Seems pretty bad for the Official Elastic helm chart. Certainly ingress-nginx will be right, it's an absolute critical dependency for the entire industry.
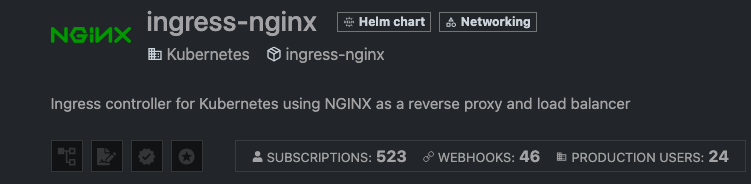
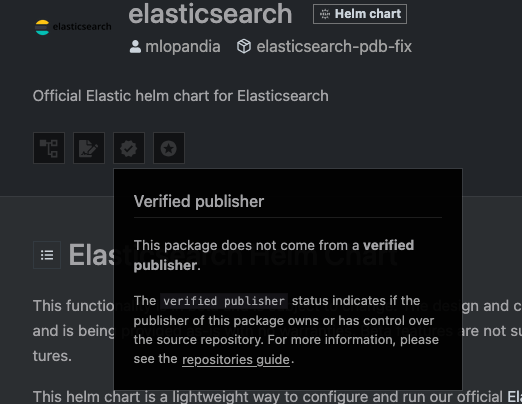
Nope. Also how is the maintainer of the chart "Kubernetes" and it's still not marked as a verified publisher. Like Christ how much more verified does it get.
- No metadata in chart searching. You can only search by name and description, not by features, capabilities, or other metadata.
- Helm doesn't strictly enforce semantic versioning
# Chart.yaml with non-semantic version
apiVersion: v2
name: myapp
version: "v1.2-alpha" - If you uninstall and reinstall a chart with CRDs, it might delete resources created by those CRDs. This one has screwed me multiple times and is crazy unsafe.
I could keep writing for another 5000 words and still wouldn't have outlined all the problems. There isn't a way to make Helm good enough for the task of "package manager for all the critical infrastructure on the planet".
What would a k8s package system look like?
Let's call our hypothetical package system KubePkg, because if there's one thing the Kubernetes ecosystem needs, it's another abbreviated name with a 'K' in it. We would try to copy as much of the existing work inside the Linux ecosystem while taking advantage of the CRD power of k8s. My idea looks something like this:
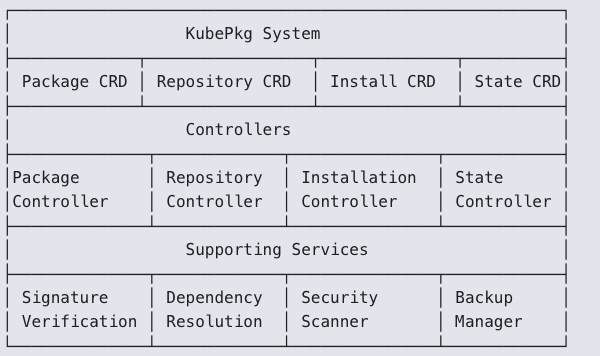
The packages are bundles like a Linux package:
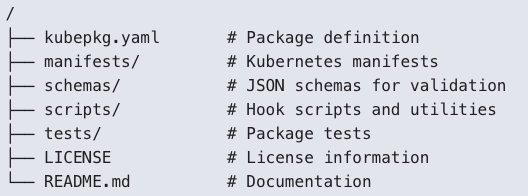
There's a definition file that accounts for as many of the real scenarios that you actually encounter when installing a thing.
apiVersion: kubepkg.io/v1
kind: Package
metadata:
  name: postgresql
  version: 14.5.2
spec:
  maintainer:
    name: "PostgreSQL Team"
    email: "maintainers@postgresql.example.com"
  description: "PostgreSQL database server"
  website: "https://postgresql.org"
  license: "PostgreSQL"

  # Dependencies with semantic versioning
  dependencies:
    - name: storage-provisioner
      versionConstraint: ">=1.0.0"
    - name: metrics-collector
      versionConstraint: "^2.0.0"
      optional: true

  # Security context and requirements
  security:
    requiredCapabilities: ["CHOWN", "SETGID", "SETUID"]
    securityContextConstraints:
      runAsUser: 999
      fsGroup: 999
    networkPolicies:
      - ports:
        - port: 5432
          protocol: TCP

  # Resources to be created (embedded or referenced)
  resources:
    - apiVersion: v1
      kind: Service
      metadata:
        name: postgresql
      spec:
        ports:
        - port: 5432
    - apiVersion: apps/v1
      kind: StatefulSet
      metadata:
        name: postgresql
      spec:
        # StatefulSet definition

  # Configuration schema using JSON Schema
  configurationSchema:
    type: object
    properties:
      replicas:
        type: integer
        minimum: 1
        default: 1
      persistence:
        type: object
        properties:
          size:
            type: string
            pattern: "^[0-9]+[GMK]i$"
            default: "10Gi"

  # Lifecycle hooks with proper sequencing
  hooks:
    preInstall:
      - name: database-prerequisites
        job:
          spec:
            template:
              spec:
                containers:
                - name: init
                  image: postgres:14.5
    postInstall:
      - name: database-init
        job:
          spec:
            # Job definition
    preUpgrade:
      - name: backup
        job:
          spec:
            # Backup job definition
    postUpgrade:
      - name: verify
        job:
          spec:
            # Verification job definition
    preRemove:
      - name: final-backup
        job:
          spec:
            # Final backup job definition

  # State management for stateful applications
  stateManagement:
    backupStrategy:
      type: "snapshot"  # or "dump"
      schedule: "0 2 * * *"  # Daily at 2 AM
      retention:
        count: 7
    recoveryStrategy:
      type: "pointInTime"
      verificationJob:
        spec:
          # Job to verify recovery success
    dataLocations:
      - path: "/var/lib/postgresql/data"
        volumeMount: "data"
    upgradeStrategies:
      - fromVersion: "*"
        toVersion: "*"
        strategy: "backup-restore"
      - fromVersion: "14.*.*"
        toVersion: "14.*.*"
        strategy: "in-place"
There's a real signing process that would be required and allow you more control over the process.
apiVersion: kubepkg.io/v1
kind: Repository
metadata:
  name: official-repo
spec:
  url: "https://repo.kubepkg.io/official"
  type: "OCI"  # or "HTTP"

  # Verification settings
  verification:
    publicKeys:
      - name: "KubePkg Official"
        keyData: |
          -----BEGIN PUBLIC KEY-----
          MIIBIjANBgkqhkiG9w0BAQEFAAOCAQ8AMIIBCgKCAQEAvF4+...
          -----END PUBLIC KEY-----
    trustPolicy:
      type: "AllowList"  # or "KeyRing"
      allowedSigners:
        - "KubePkg Official"
        - "Trusted Partner"
    verificationLevel: "Strict"  # or "Warn", "None"
Like how great would it be to have something where I could automatically update packages without needing to do anything on my side.
apiVersion: kubepkg.io/v1
kind: Installation
metadata:
  name: postgresql-main
  namespace: database
spec:
  packageRef:
    name: postgresql
    version: "14.5.2"

  # Configuration values (validated against schema)
  configuration:
    replicas: 3
    persistence:
      size: "100Gi"
    resources:
      limits:
        memory: "4Gi"
        cpu: "2"

  # Update policy
  updatePolicy:
    automatic: false
    allowedVersions: "14.x.x"
    schedule: "0 2 * * 0"  # Weekly on Sunday at 2am
    approvalRequired: true

  # State management reference
  stateRef:
    name: postgresql-main-state

  # Service account to use
  serviceAccountName: postgresql-installer
What k8s needs is a system that meets the following requirements:
- True Kubernetes Native: Everything is a Kubernetes resource with proper status and events
- First-Class State Management: Built-in support for stateful applications
- Enhanced Security: Robust signing, verification, and security scanning
- Declarative Configuration: No templates, just structured configuration with schemas
- Lifecycle Management: Comprehensive lifecycle hooks and upgrade strategies
- Dependency Resolution: Linux-like dependency management with semantic versioning
- Audit Trail: Complete history of changes with who, what, and when, not what Helm currently provides.
- Policy Enforcement: Support for organizational policies and compliance.
- Simplified User Experience: Familiar Linux-like package management commands. It seems wild that we're trying to go a different direction from the package systems that have worked for decades.
IPv6 By Default
Try to imagine, across the entire globe, how much time and energy has been invested in trying to solve any one of the following three problems.
- I need this pod in this cluster to talk to that pod in that cluster.
- There is a problem happening somewhere in the NAT traversal process and I need to solve it
- I have run out of IP addresses with my cluster because I didn't account for how many you use. Remember: A company starting with a /20 subnet (4,096 addresses), deploys 40 nodes with 30 pods each, and suddenly realizes they're approaching their IP limit. Not that many nodes!
I am not suggesting the entire internet switches over to IPv6 and right now k8s happily supports IPv6-only if you want and a dualstack approach. But I'm saying now is the time to flip the default and just go IPv6. You eliminate a huge collection of problems all at once.
- Flatter, less complicated network topology inside of the cluster.
- The distinction between multiple clusters becomes a thing organizations can choose to ignore if they want if they want to get public IPs.
- Easier to understand exactly the flow of traffic inside of your stack.
- Built-in IPSec
It has nothing to do with driving IPv6 adoption across the entire globe and just an acknowledgement that we no longer live in a world where you have to accept the weird limitations of IPv4 in a universe where you may need 10,000 IPs suddenly with very little warning.
The benefits for organizations with public IPv6 addresses is pretty obvious, but there's enough value there for cloud providers and users that even the corporate overlords might get behind it. AWS never needs to try and scrounge up more private IPv4 space inside of a VPC. That's gotta be worth something.
Conclusion
The common rebuttal to these ideas is, "Kubernetes is an open platform, so the community can build these solutions." While true, this argument misses a crucial point: defaults are the most powerful force in technology. The "happy path" defined by the core project dictates how 90% of users will interact with it. If the system defaults to expecting signed packages and provides a robust, native way to manage them, that is what the ecosystem will adopt.
This is an ambitious list, I know. But if we're going to dream, let's dream big. After all, we're the industry that thought naming a technology 'Kubernetes' would catch on, and somehow it did!
We see this all the time in other areas like mobile developer and web development, where platforms assess their situation and make radical jumps forward. Not all of these are necessarily projects that the maintainers or companies would take on but I think they're all ideas that someone should at least revisit and think "is it worth doing now that we're this nontrivial percentage of all datacenter operations on the planet"?
Questions/feedback/got something wrong? Find me here: https://c.im/@matdevdug


Unmesh, Gitanjali, and I finish our list of characteristics of an Expert Generalist by describing how these folks favor fundamental knowledge in a domain, possess a blend of broad and deep skills, and know how to build a rough, perceptive sense - a sympathy - for related domains.
Today I was trying to figure out how to parse a string into an array in zsh, and eventually found the zsh cheat sheet. This should definitely be posted somewhere much easier to find, or maybe should just be the beginning of the zsh man page.